 Municipal GIS Partners
Emergency Vehicle Preemption Dashboard
Designed and delivered a real-time ArcGIS Online dashboard and Experience that consolidates preemption device status, location, and component health into a single, operational view—giving teams the clarity to monitor system readiness, coordinate faster, and act before issues become incidents.
 Municipal GIS Partners
Sustainability StoryMap (ArcGIS Online)
Translated sustainability metrics into a narrative StoryMap with interactive charts and maps for Northbrook—turning siloed datasets into a clear, public-facing experience that's easy to maintain and effortless to understand.
 Municipal GIS Partners
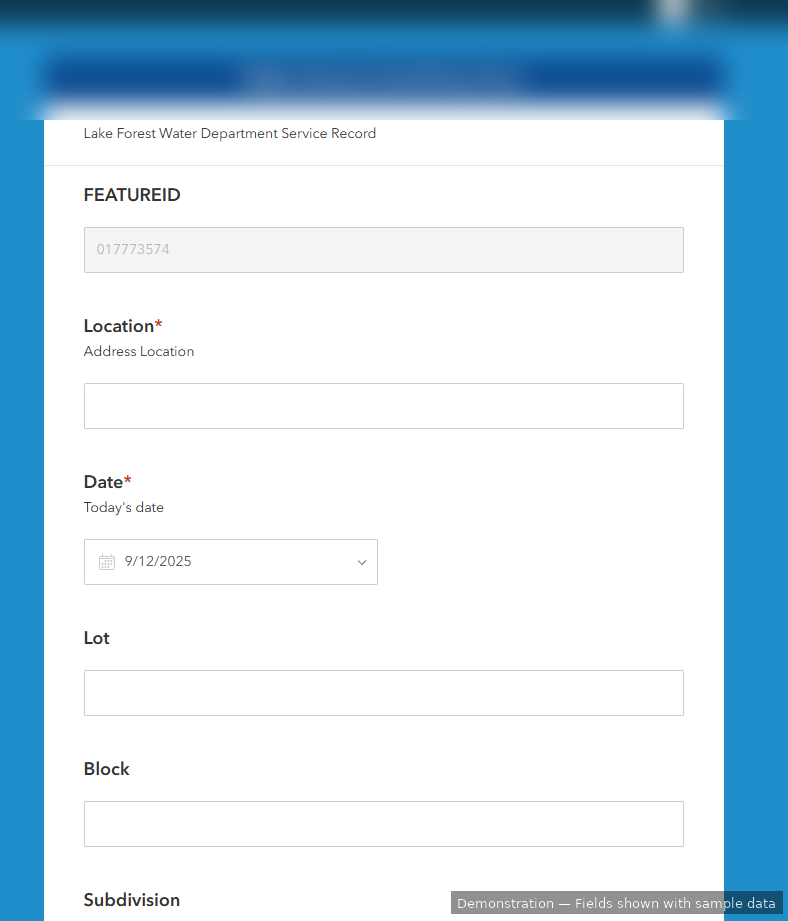
Water Service Card Modernization (100-Year Legacy → Digital + AI-Ready)
Replaced a century-old, image-based workflow with a structured Survey123 data model and automated record linking—creating a searchable system of record and a migration path to analytics. I'm also exploring a locally run LLM to digitize historical cards securely and at scale.
 Municipal GIS Partners
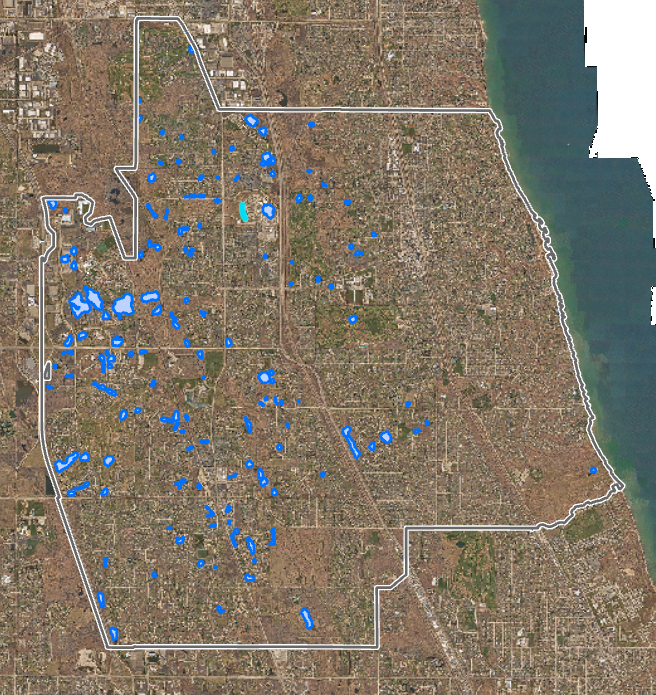
Pond Ownership Inventory Dashboard
Automated the discovery of every pond inside municipal boundaries with Google Earth Engine, refined the dataset in ArcGIS Pro, and deployed an ArcGIS Experience Builder workspace so staff could co-manage ownership verification without leaving the browser.
 Municipal GIS Partners
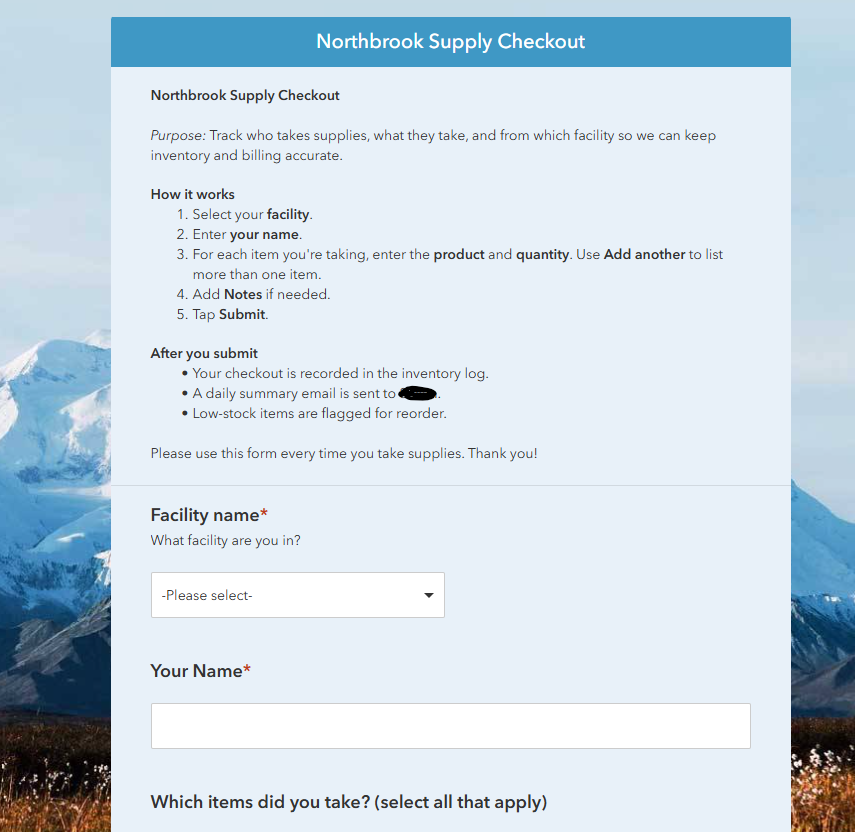
Supply Inventory Tracking System
Designed a supply inventory tracking system for the Village of Northbrook that allows staff to log supply usage through a simple QR-based form. Built an automated ArcGIS Online notebook to process submissions, update inventory levels, and maintain a detailed audit trail, creating transparency, accountability, and real-time visibility into supply trends.
Fiber Line Linking & Depth/DFP Pilot
Standardized drawing sets and linked each fiber segment in GIS to its authoritative PDF source, then piloted depth and distance-from-pavement values at ~20-foot intervals in ArcGIS Online—bringing field crews precise, click-through access to the data they need.
 Automation
Automation — Utility Atlas Requests (Python + Power Automate)
Built a Python/ArcPy exporter and an email-driven Power Automate flow to geocode addresses, toggle the right layers, and generate Water/Storm/Sanitary PDFs—cutting manual requests from minutes to near hands-off execution with consistent outputs and file naming.
 Automation
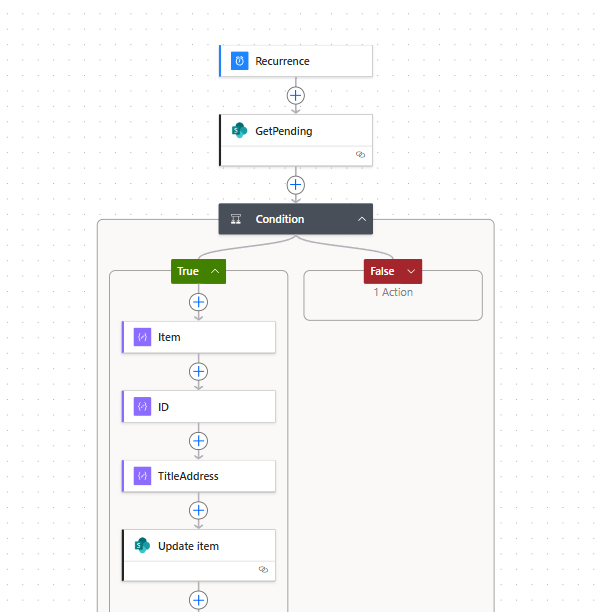
Automation — Zoning Variance Updates (Survey123 → SDE)
Engineered a Survey123 → Power Automate (cloud & desktop) → ArcPy pipeline that geocodes, parcel-matches, inserts into SDE, deduplicates, and logs each transaction—turning a manual back-office task into a near real-time, reliable update.
 Municipal GIS Partners
Water Service Card Reviewer
Deployed Qwen2.5-VL to read 100-year-old water service cards full of cursive annotations, smudges, and typewriter ink. A Python pipeline normalizes the model output, enforces the utility schema, and bulk-loads validated attributes into enterprise GIS feature classes—bringing field histories into a searchable system without manual transcription.
 Municipal GIS Partners
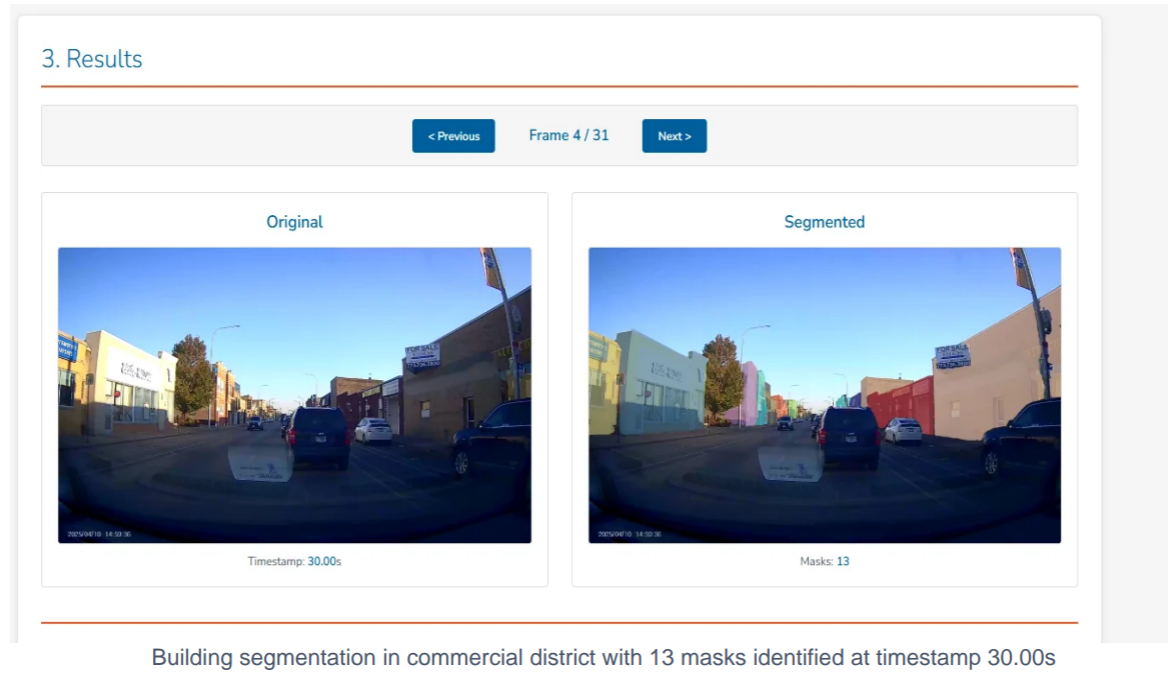
Computer Vision Spatial Data Pipeline (SAM3 + ZED 2i) - In Progress
Developing and validating a vision-first workflow that turns real-world imagery into GIS-ready spatial data. SAM3 segmentation extracts precise outlines and relationships, while ZED 2i stereo depth captures metric measurements and 3D point clouds for spatially anchored assets.
ATLAS ArcGIS Online MCP - In Progress
Developing an MCP server for agentic interactions that reimagines ArcGIS Online workflows, enabling AI agents to execute GIS operations, orchestrate tasks, and automate spatial analysis with structured, auditable actions.
 Municipal GIS Partners
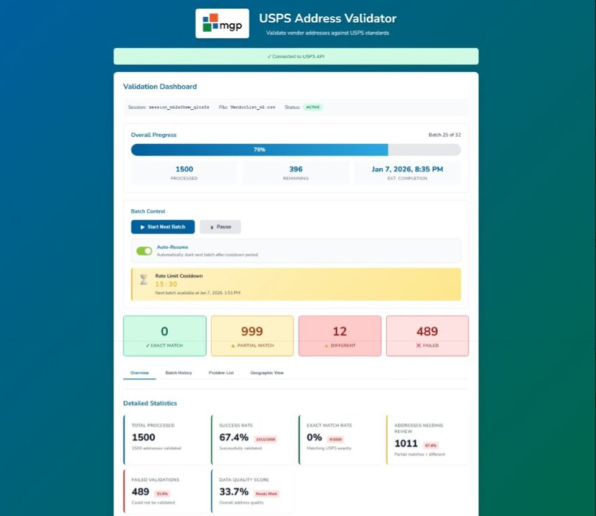
USPS Address Validator
Built an internal validation tool that verifies thousands of municipal address records against the official USPS database—identifying correct, partially correct, and invalid entries before system migrations or data cleanup projects. Staff upload spreadsheets, monitor progress through an interactive dashboard with map visualization, and export corrected data to ensure clean records enter their new systems.
 Municipal GIS Partners
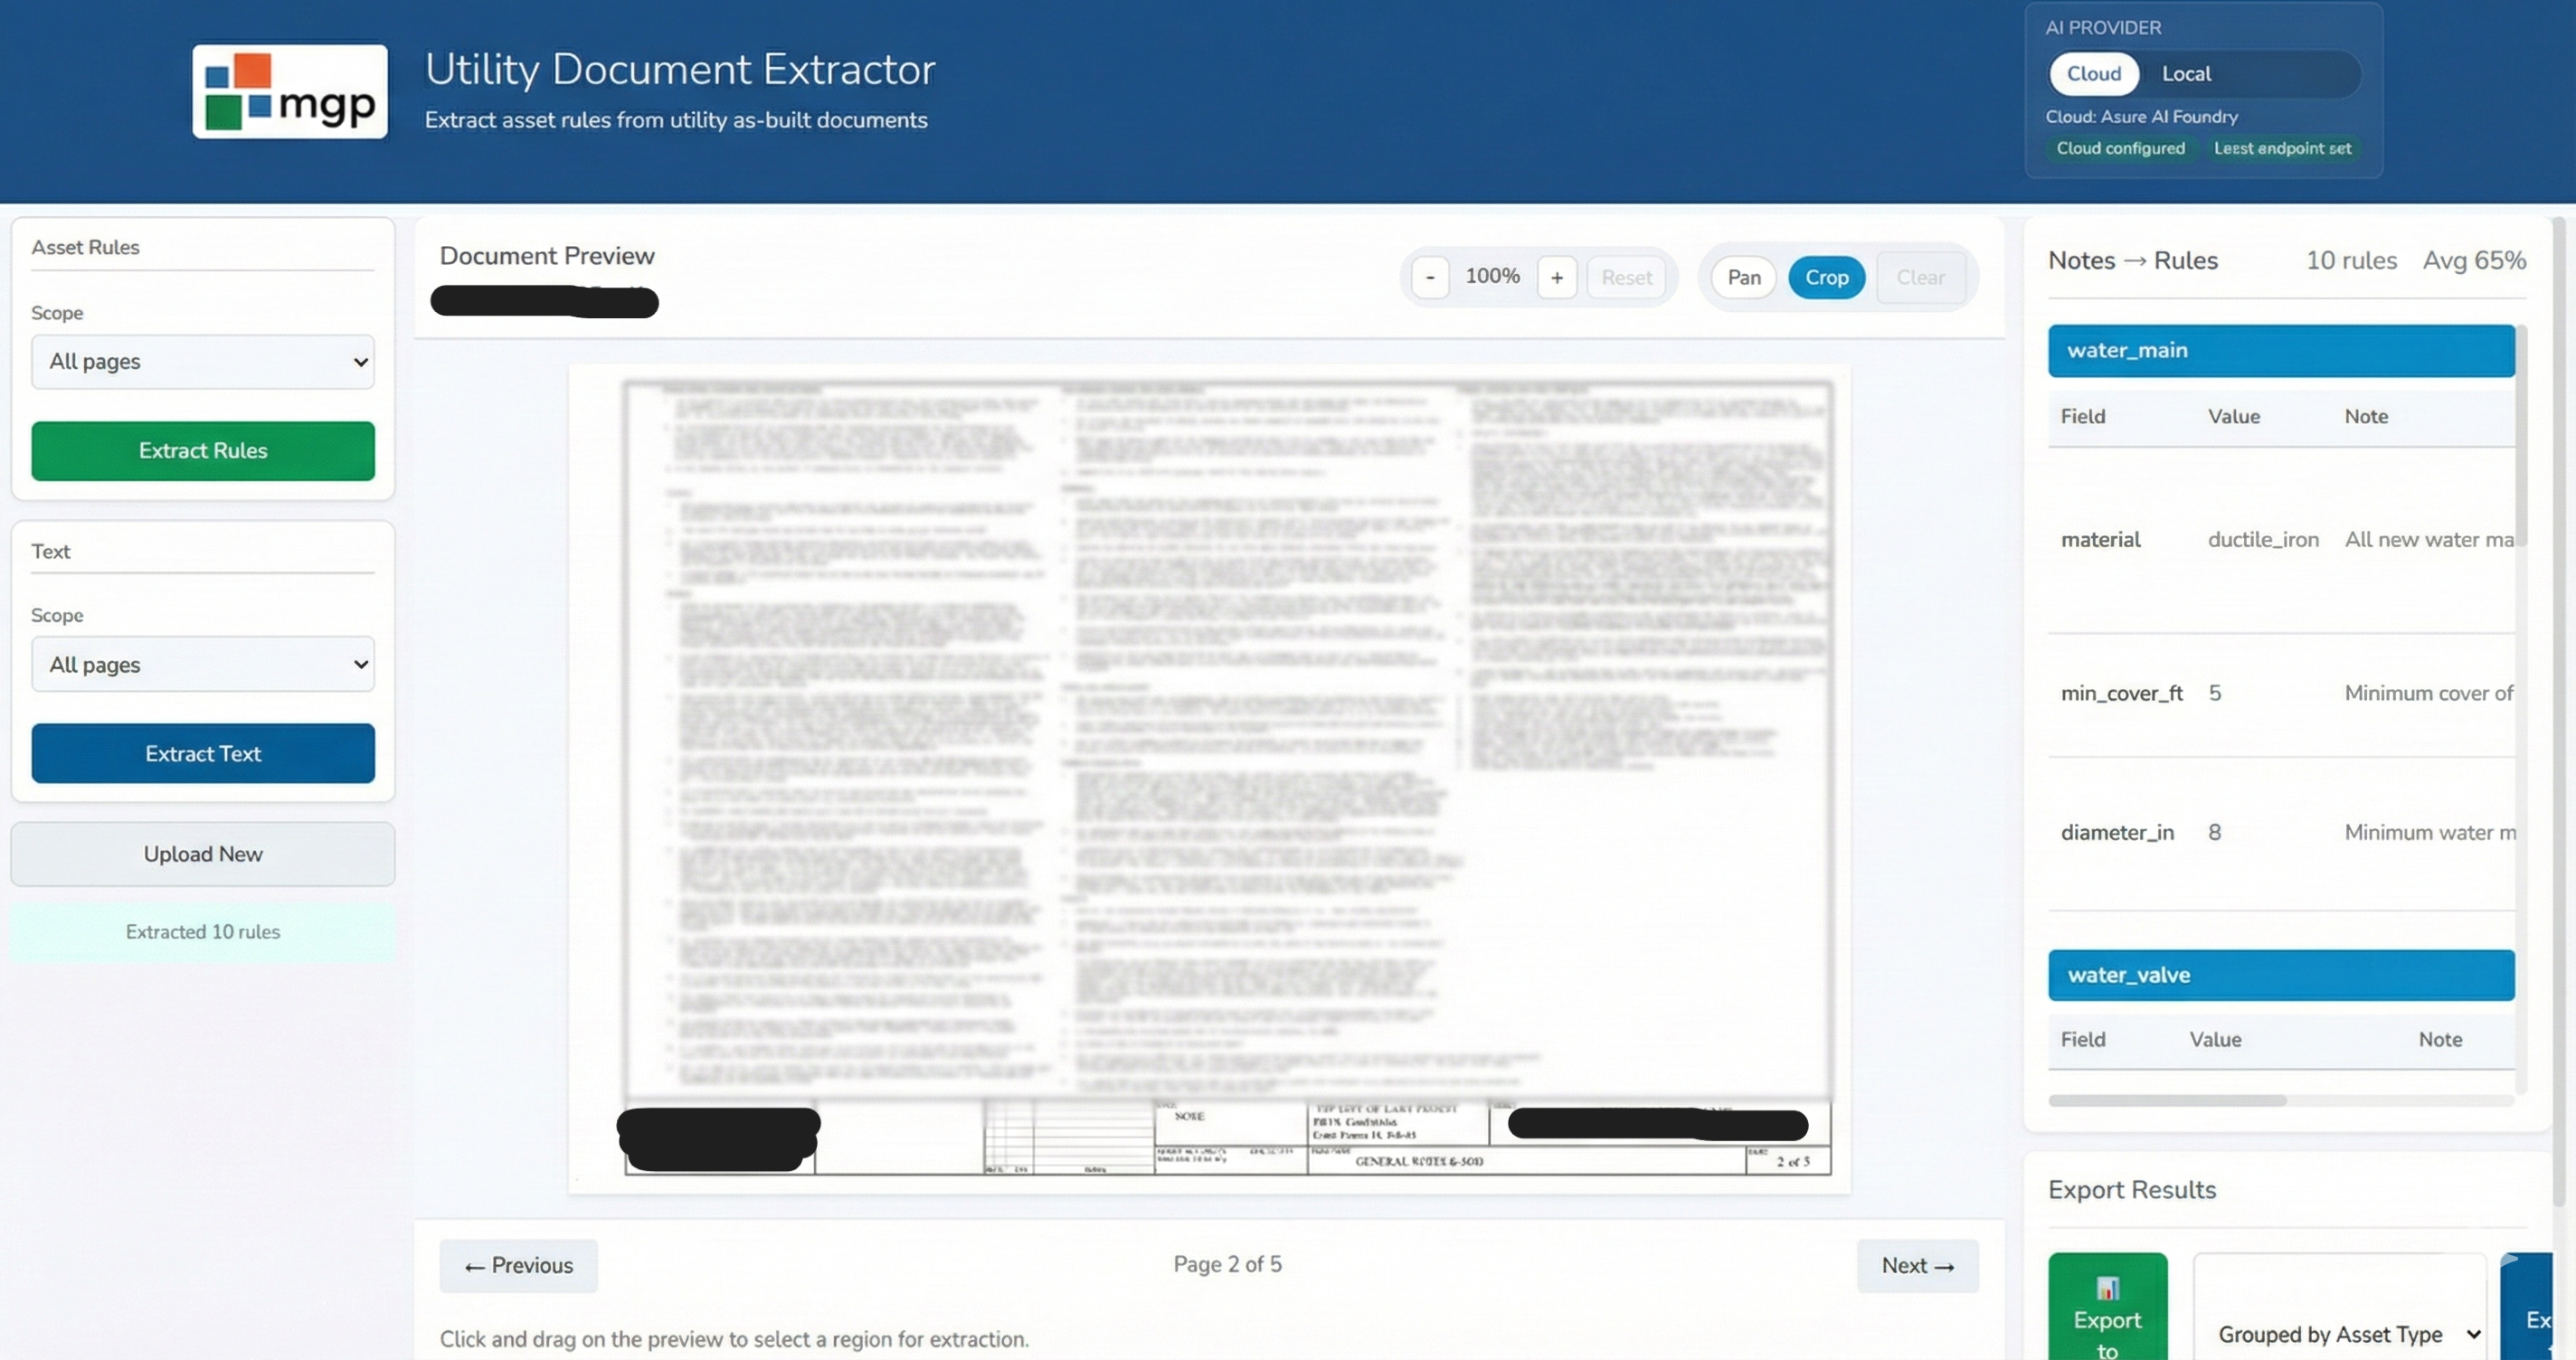
Utility Document Extractor (AI-Powered GIS Asset Rule Extraction)
Engineered an AI-powered React platform that transforms decades of unstructured utility as-built drawings and permits into structured GIS asset rules. Vision-capable models (Azure AI Foundry or local Ollama) extract asset types, field names, and default values from scanned PDFs—validated through a human-in-the-loop review interface before exporting to ArcGIS-compatible CSV and engineering documentation.
 Scouting America
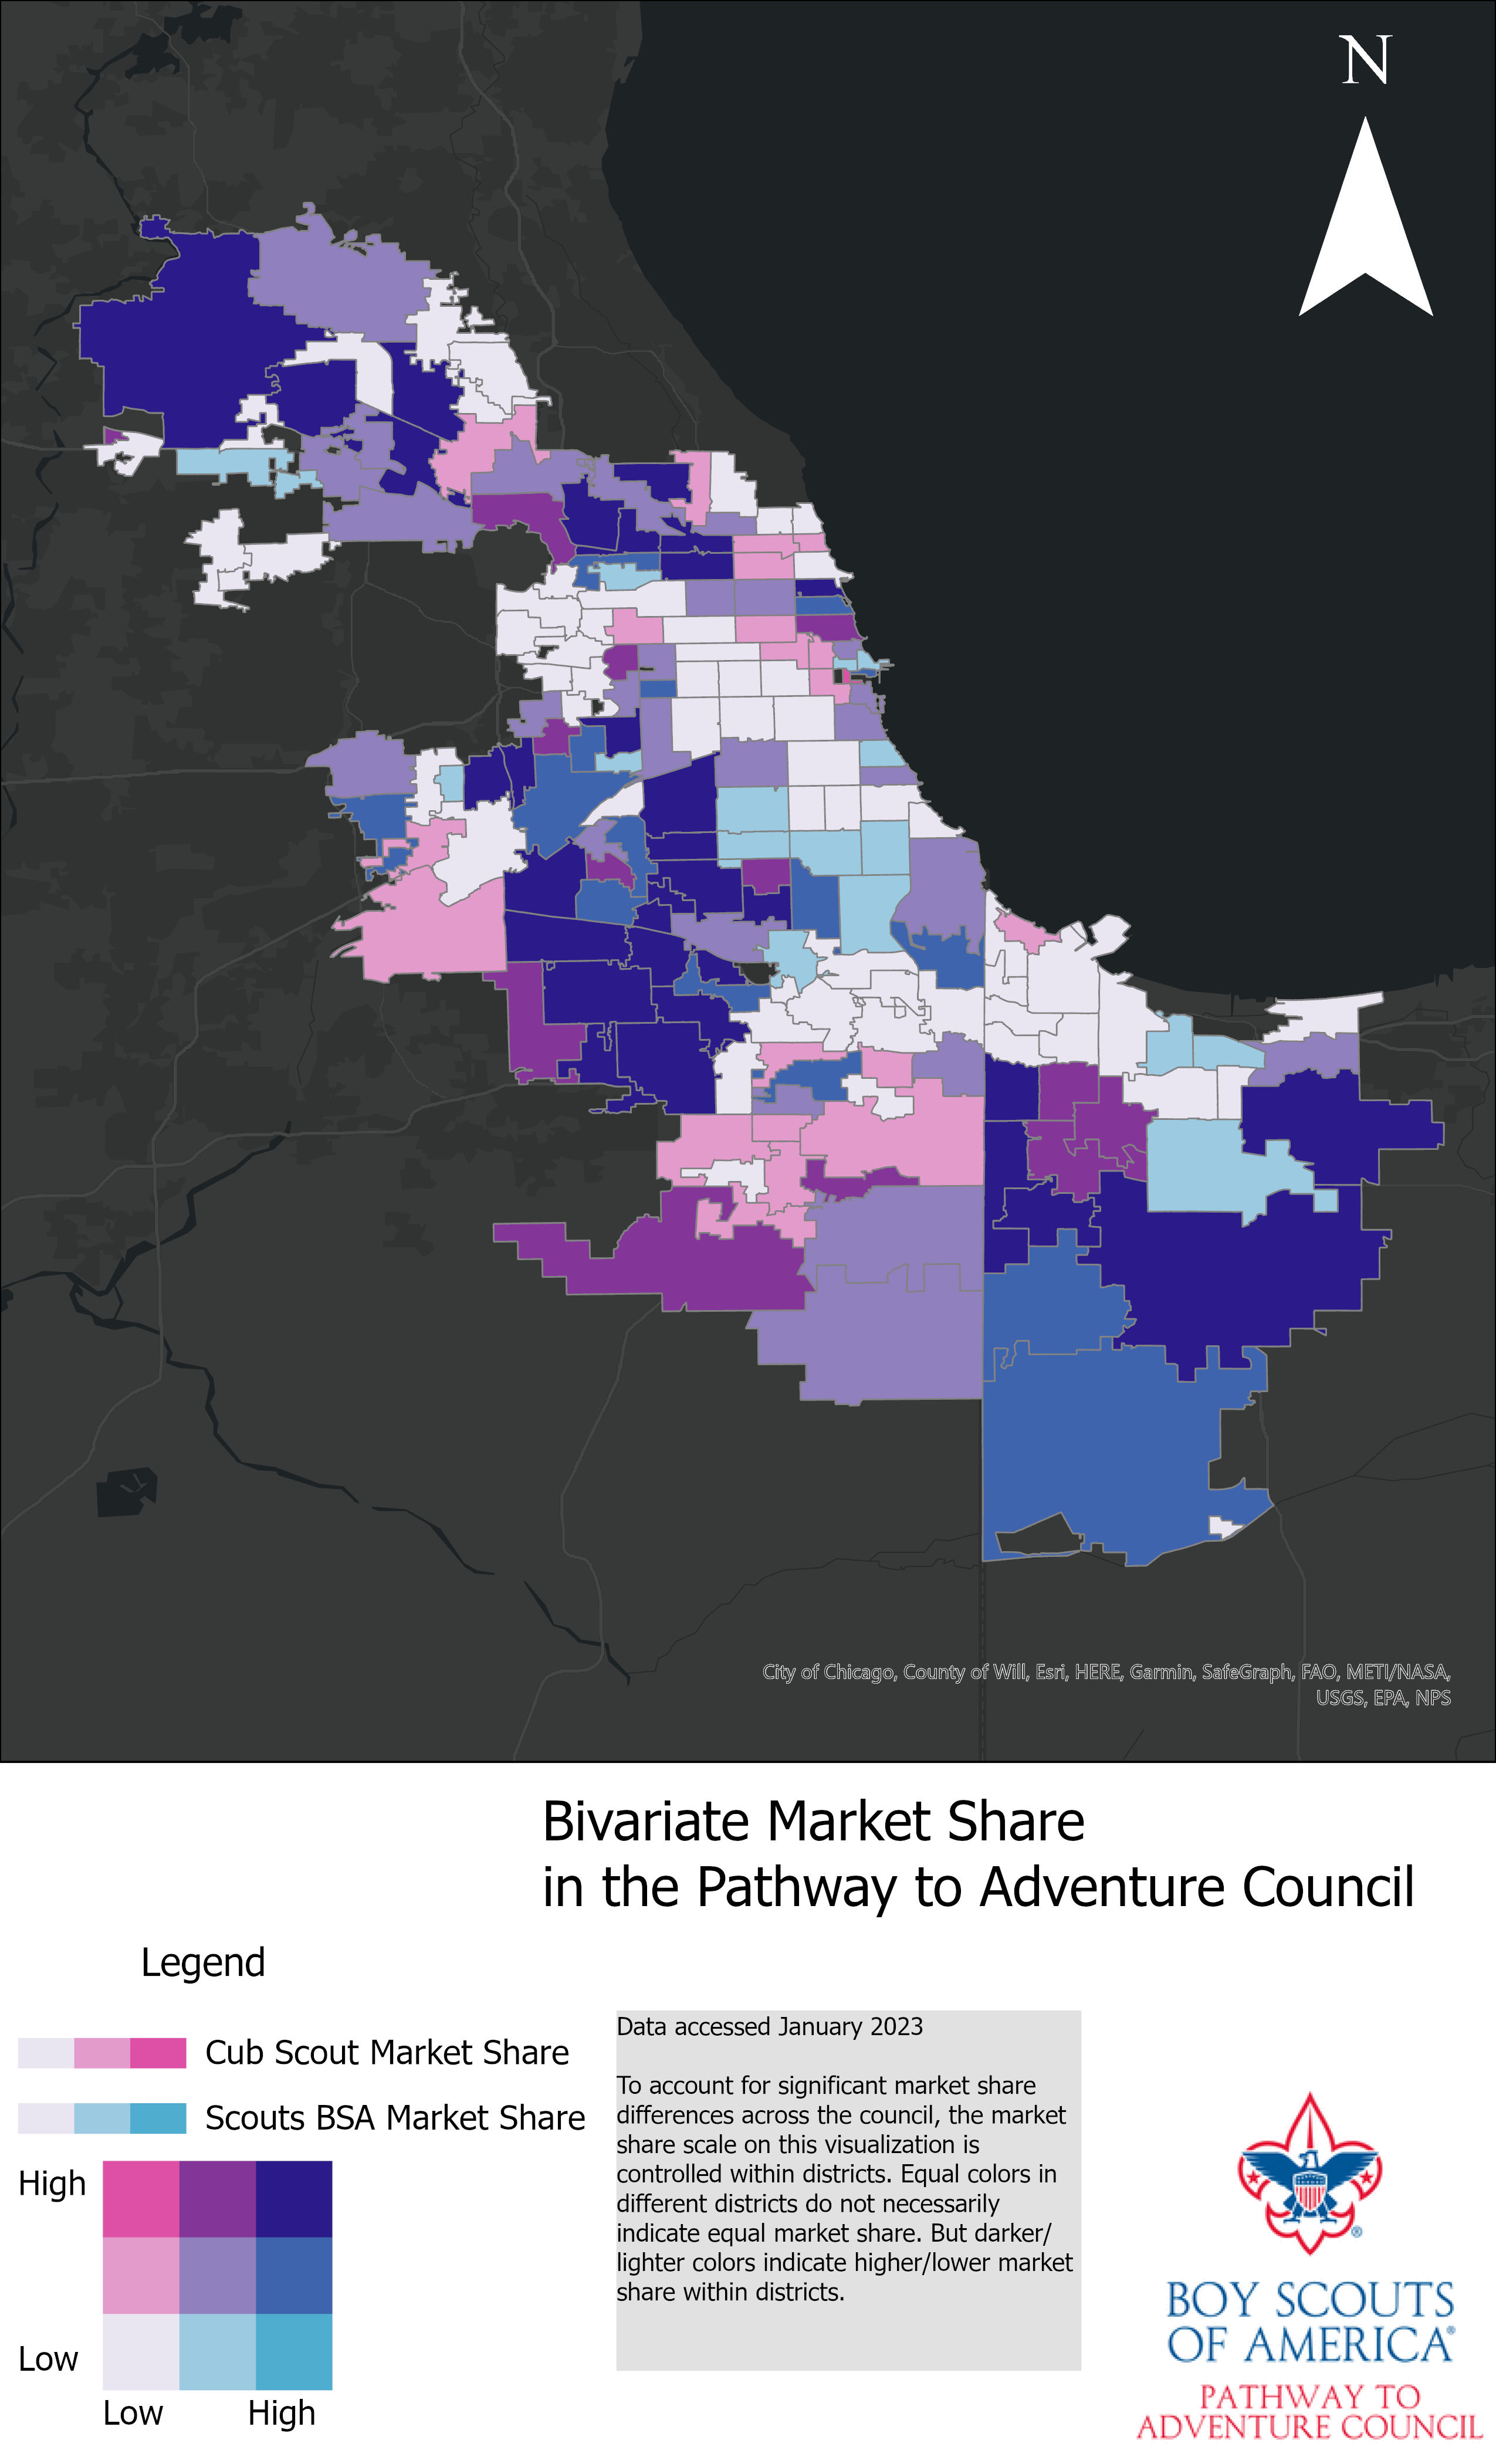
Bivariate Market Share Analysis
This analysis explores the relationship between Cub Scout and Scouts BSA membership density across ZIP codes within the Pathway to Adventure Council. The objective is to evaluate whether areas with higher Cub Scout participation are associated with stronger Scouts BSA membership, providing insight into long-term recruitment trends.
 Scouting America
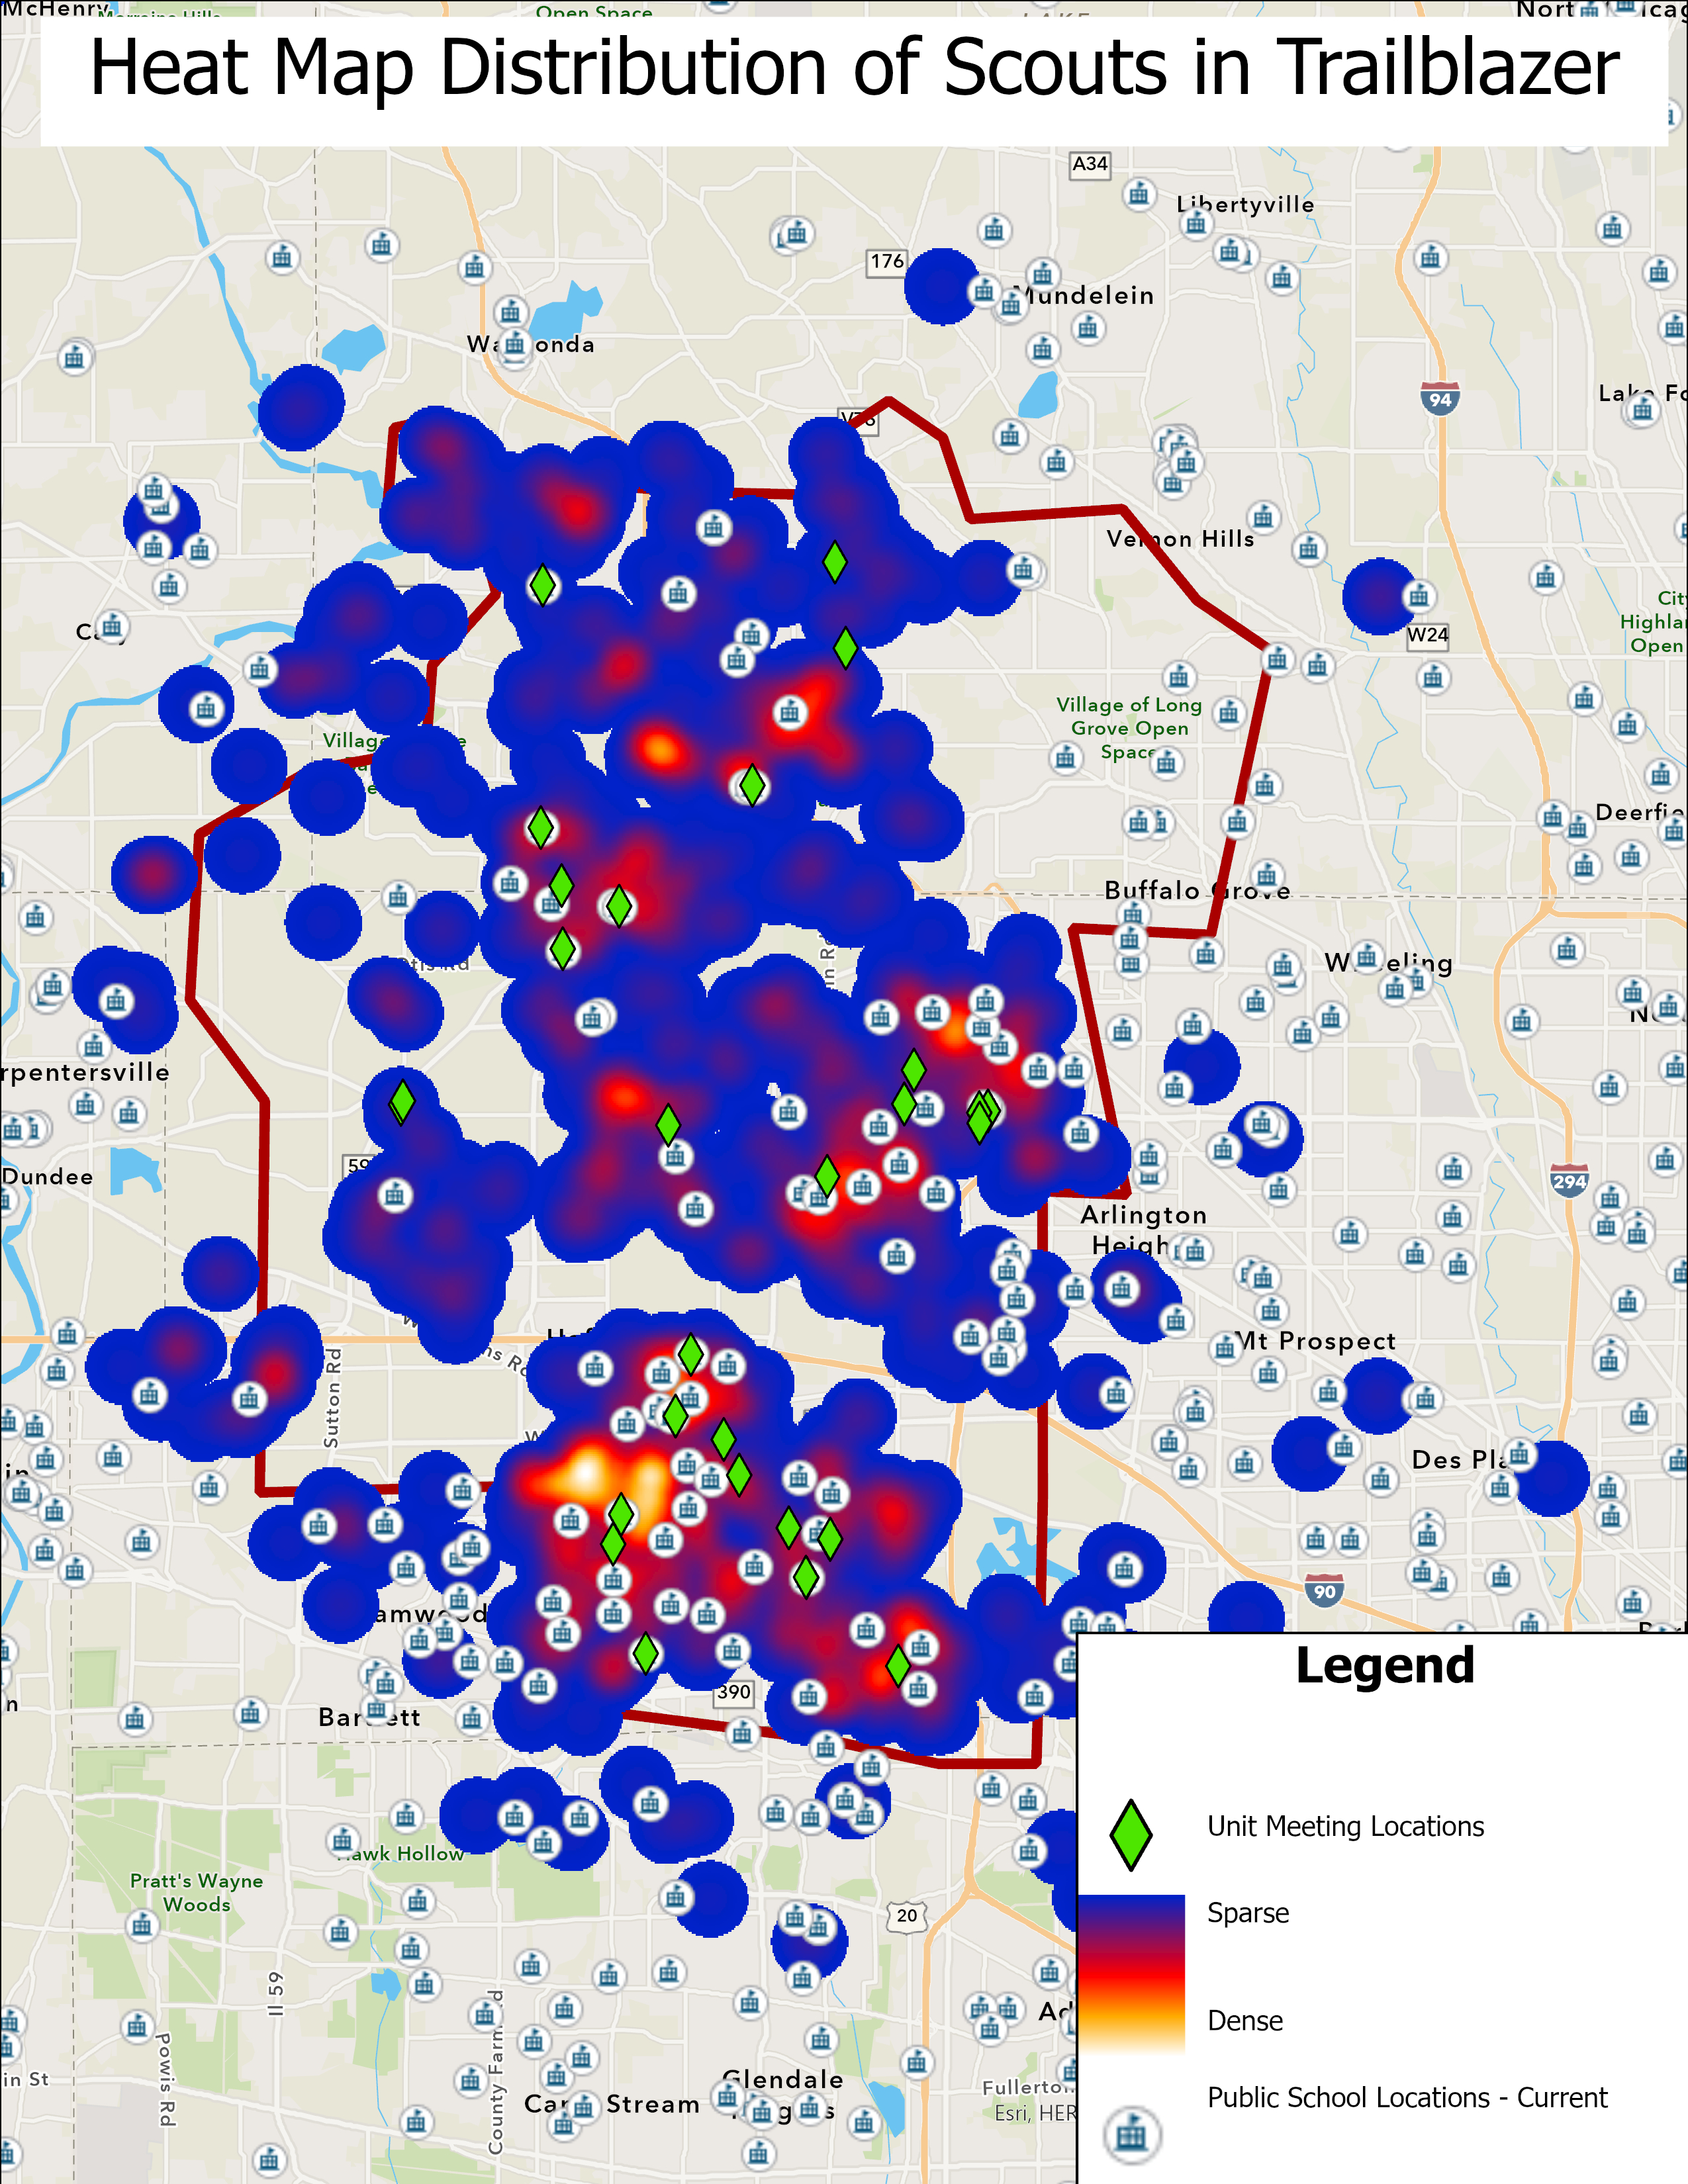
Heat Map of Scouts
This heat map visualizes the density of Scouting members within the Trailblazer District, where I was responsible for membership growth and engagement. It charts unit meeting locations, school locations, and Scout residences, providing a comprehensive view of membership distribution.
 Scouting America
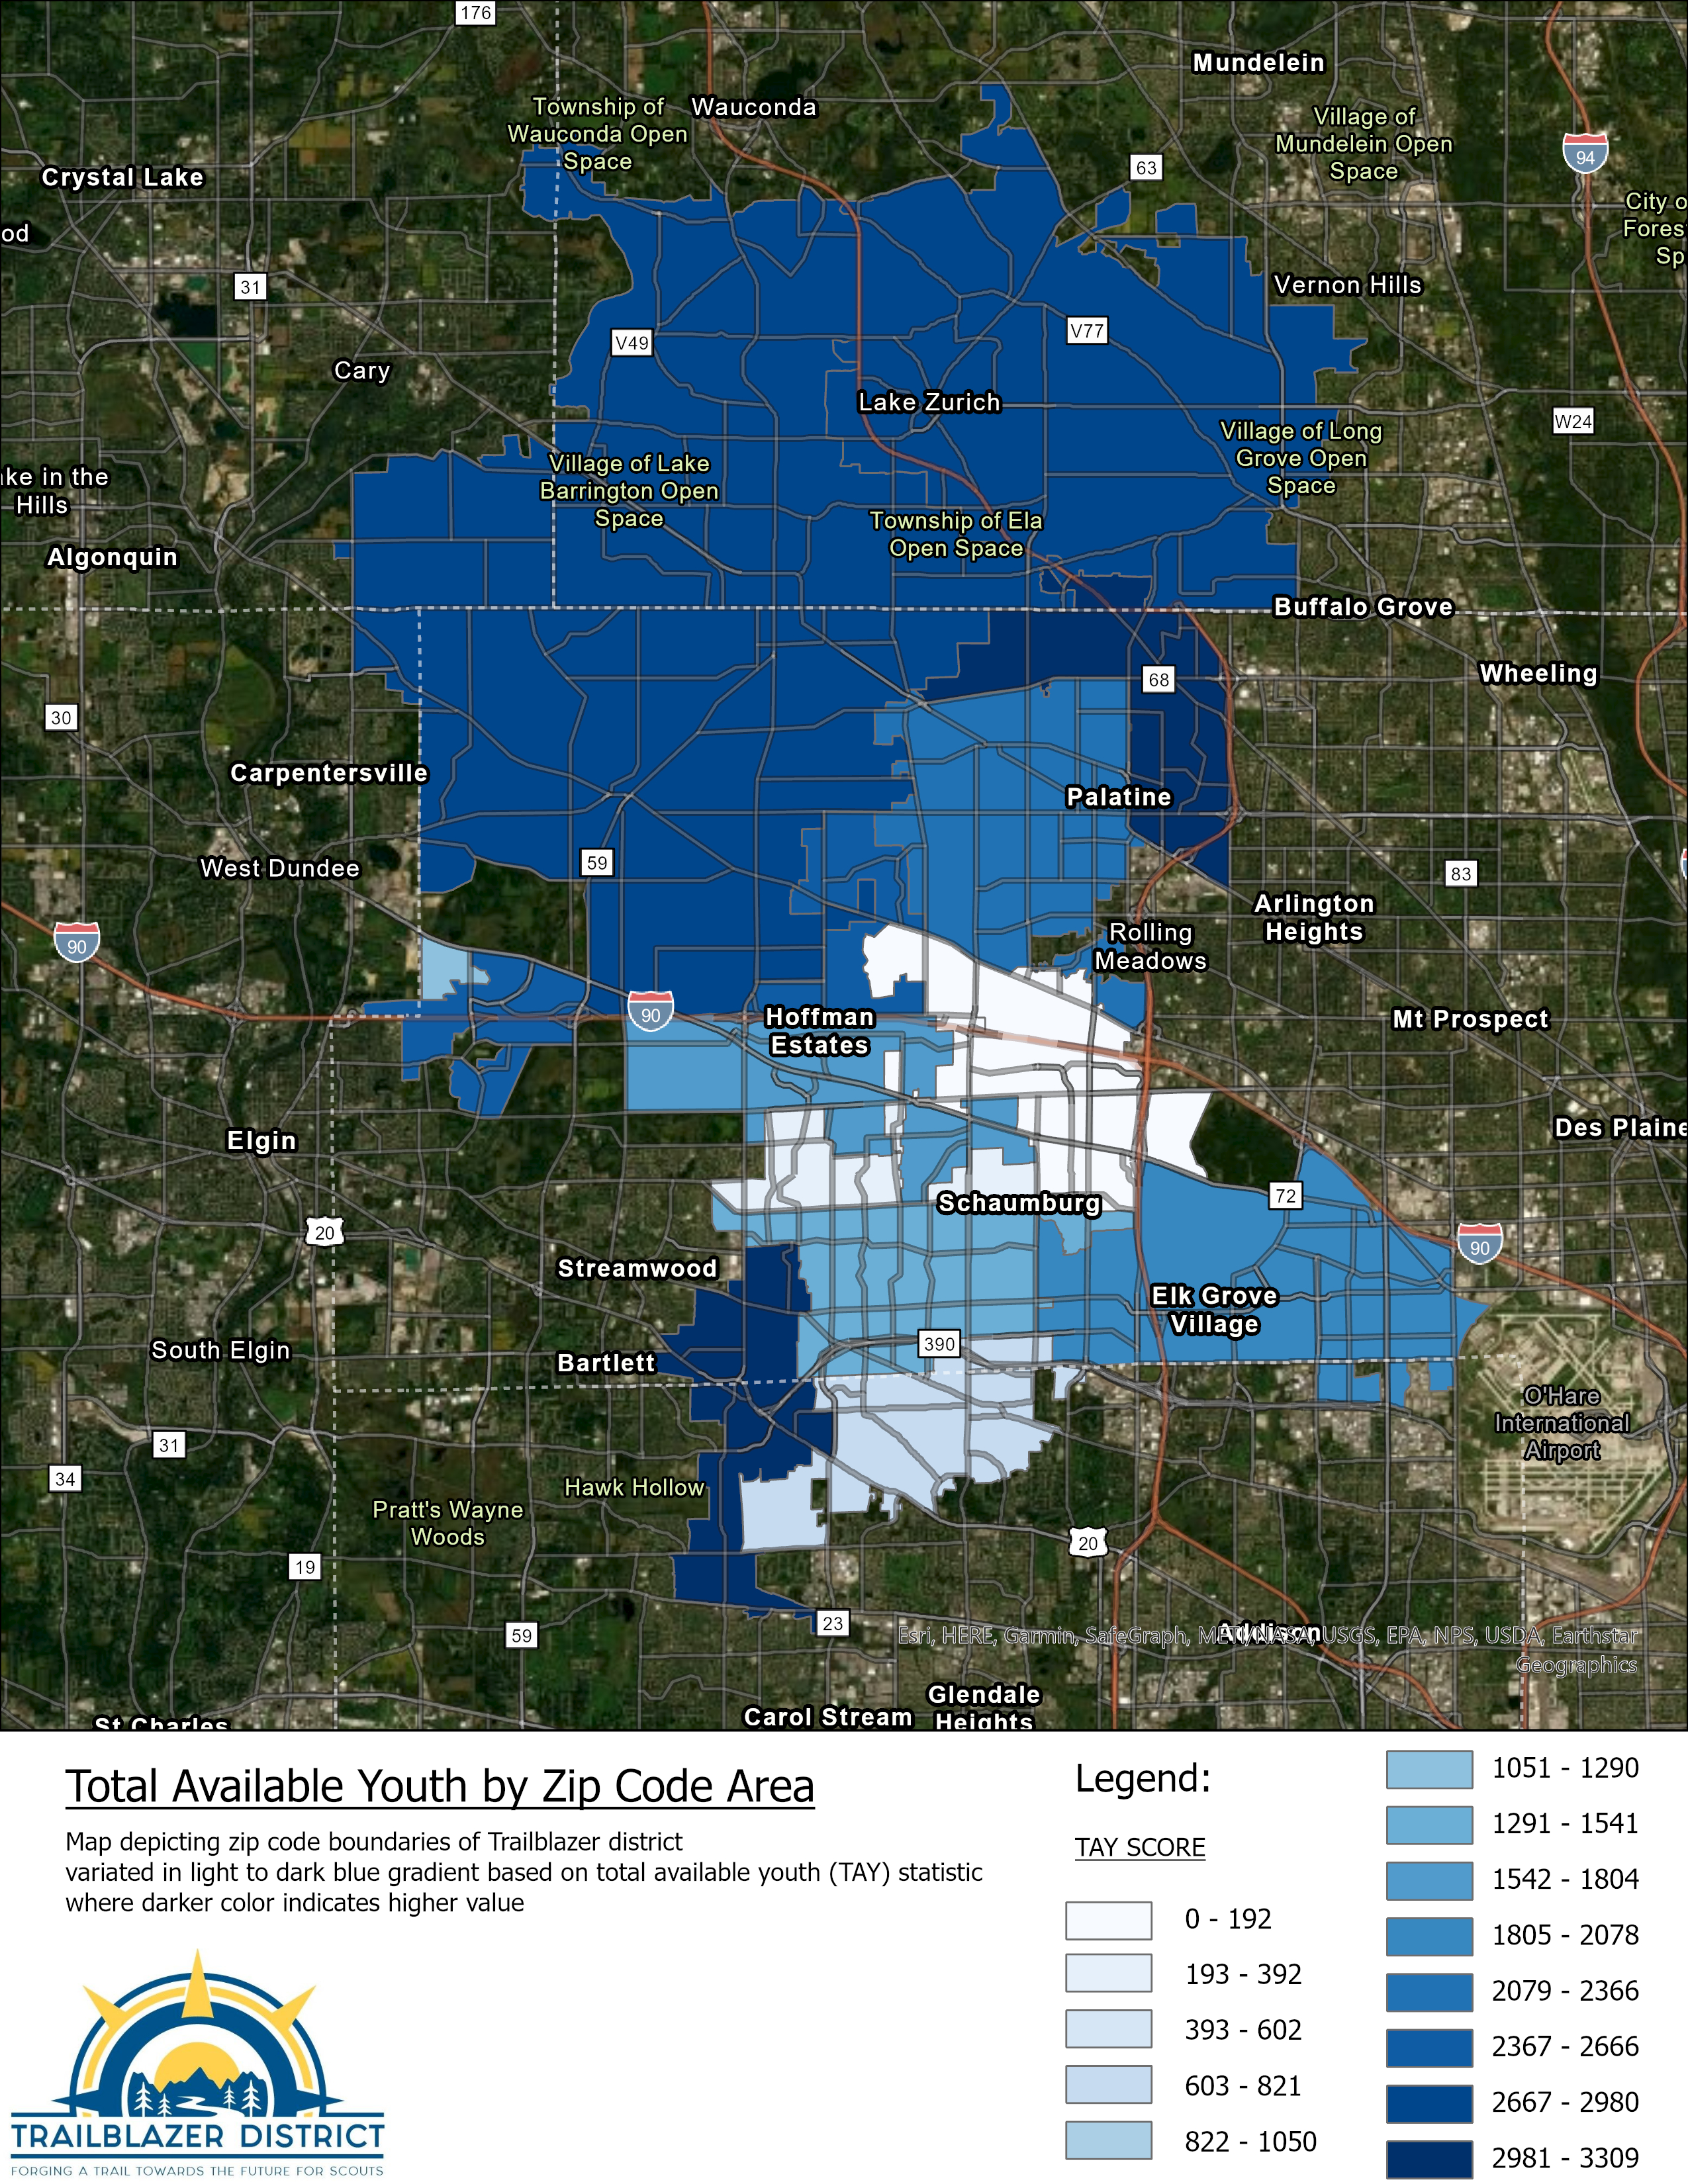
Total Available Youth (TAY) in Trailblazer District
This map visualizes the Total Available Youth (TAY) by zip code within the Trailblazer District, providing a data-driven perspective on recruitment potential. TAY is a key metric used by Scouting America to estimate the total number of Scout-age youth who are eligible to be recruited into the program.
 Scouting America
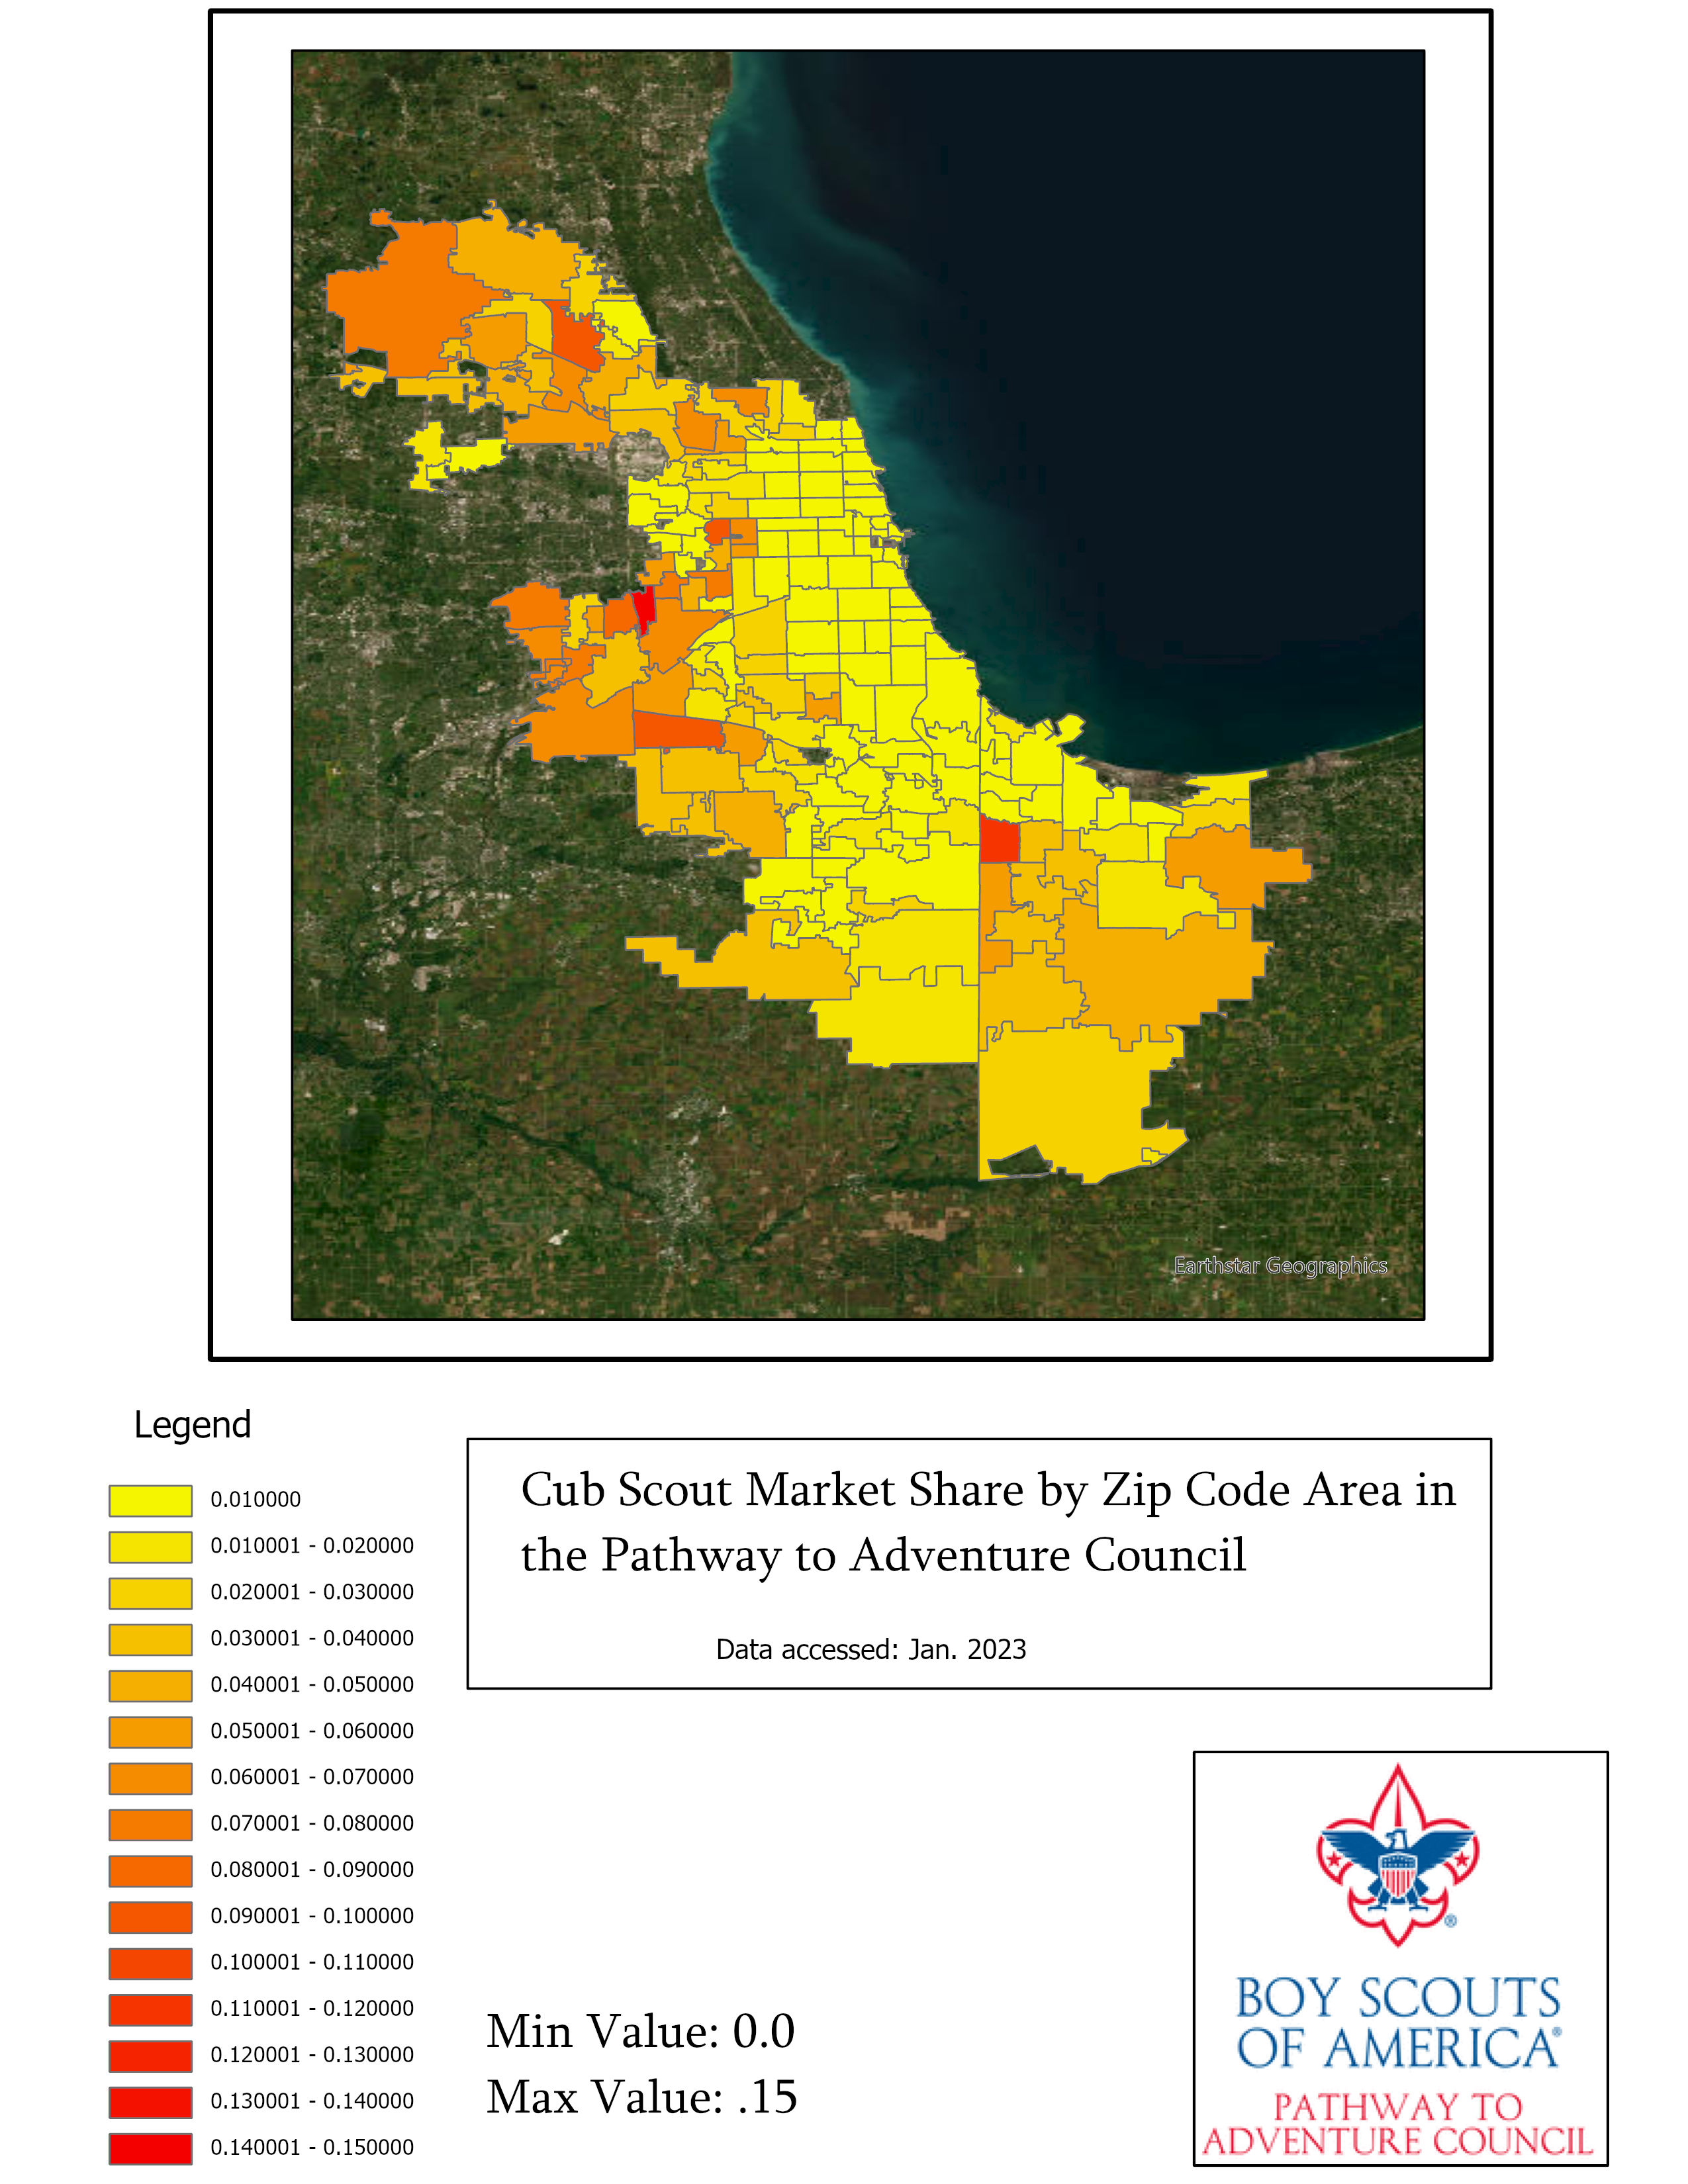
Total Cub Scout Market Share
This analysis examines the overall market share of Cub Scouts in relation to the total youth population, providing valuable insight into membership trends and recruitment potential. By comparing Cub Scout participation with broader demographic data, it identifies areas where Scouting is well-established and where there are opportunities for growth.
 Scouting America
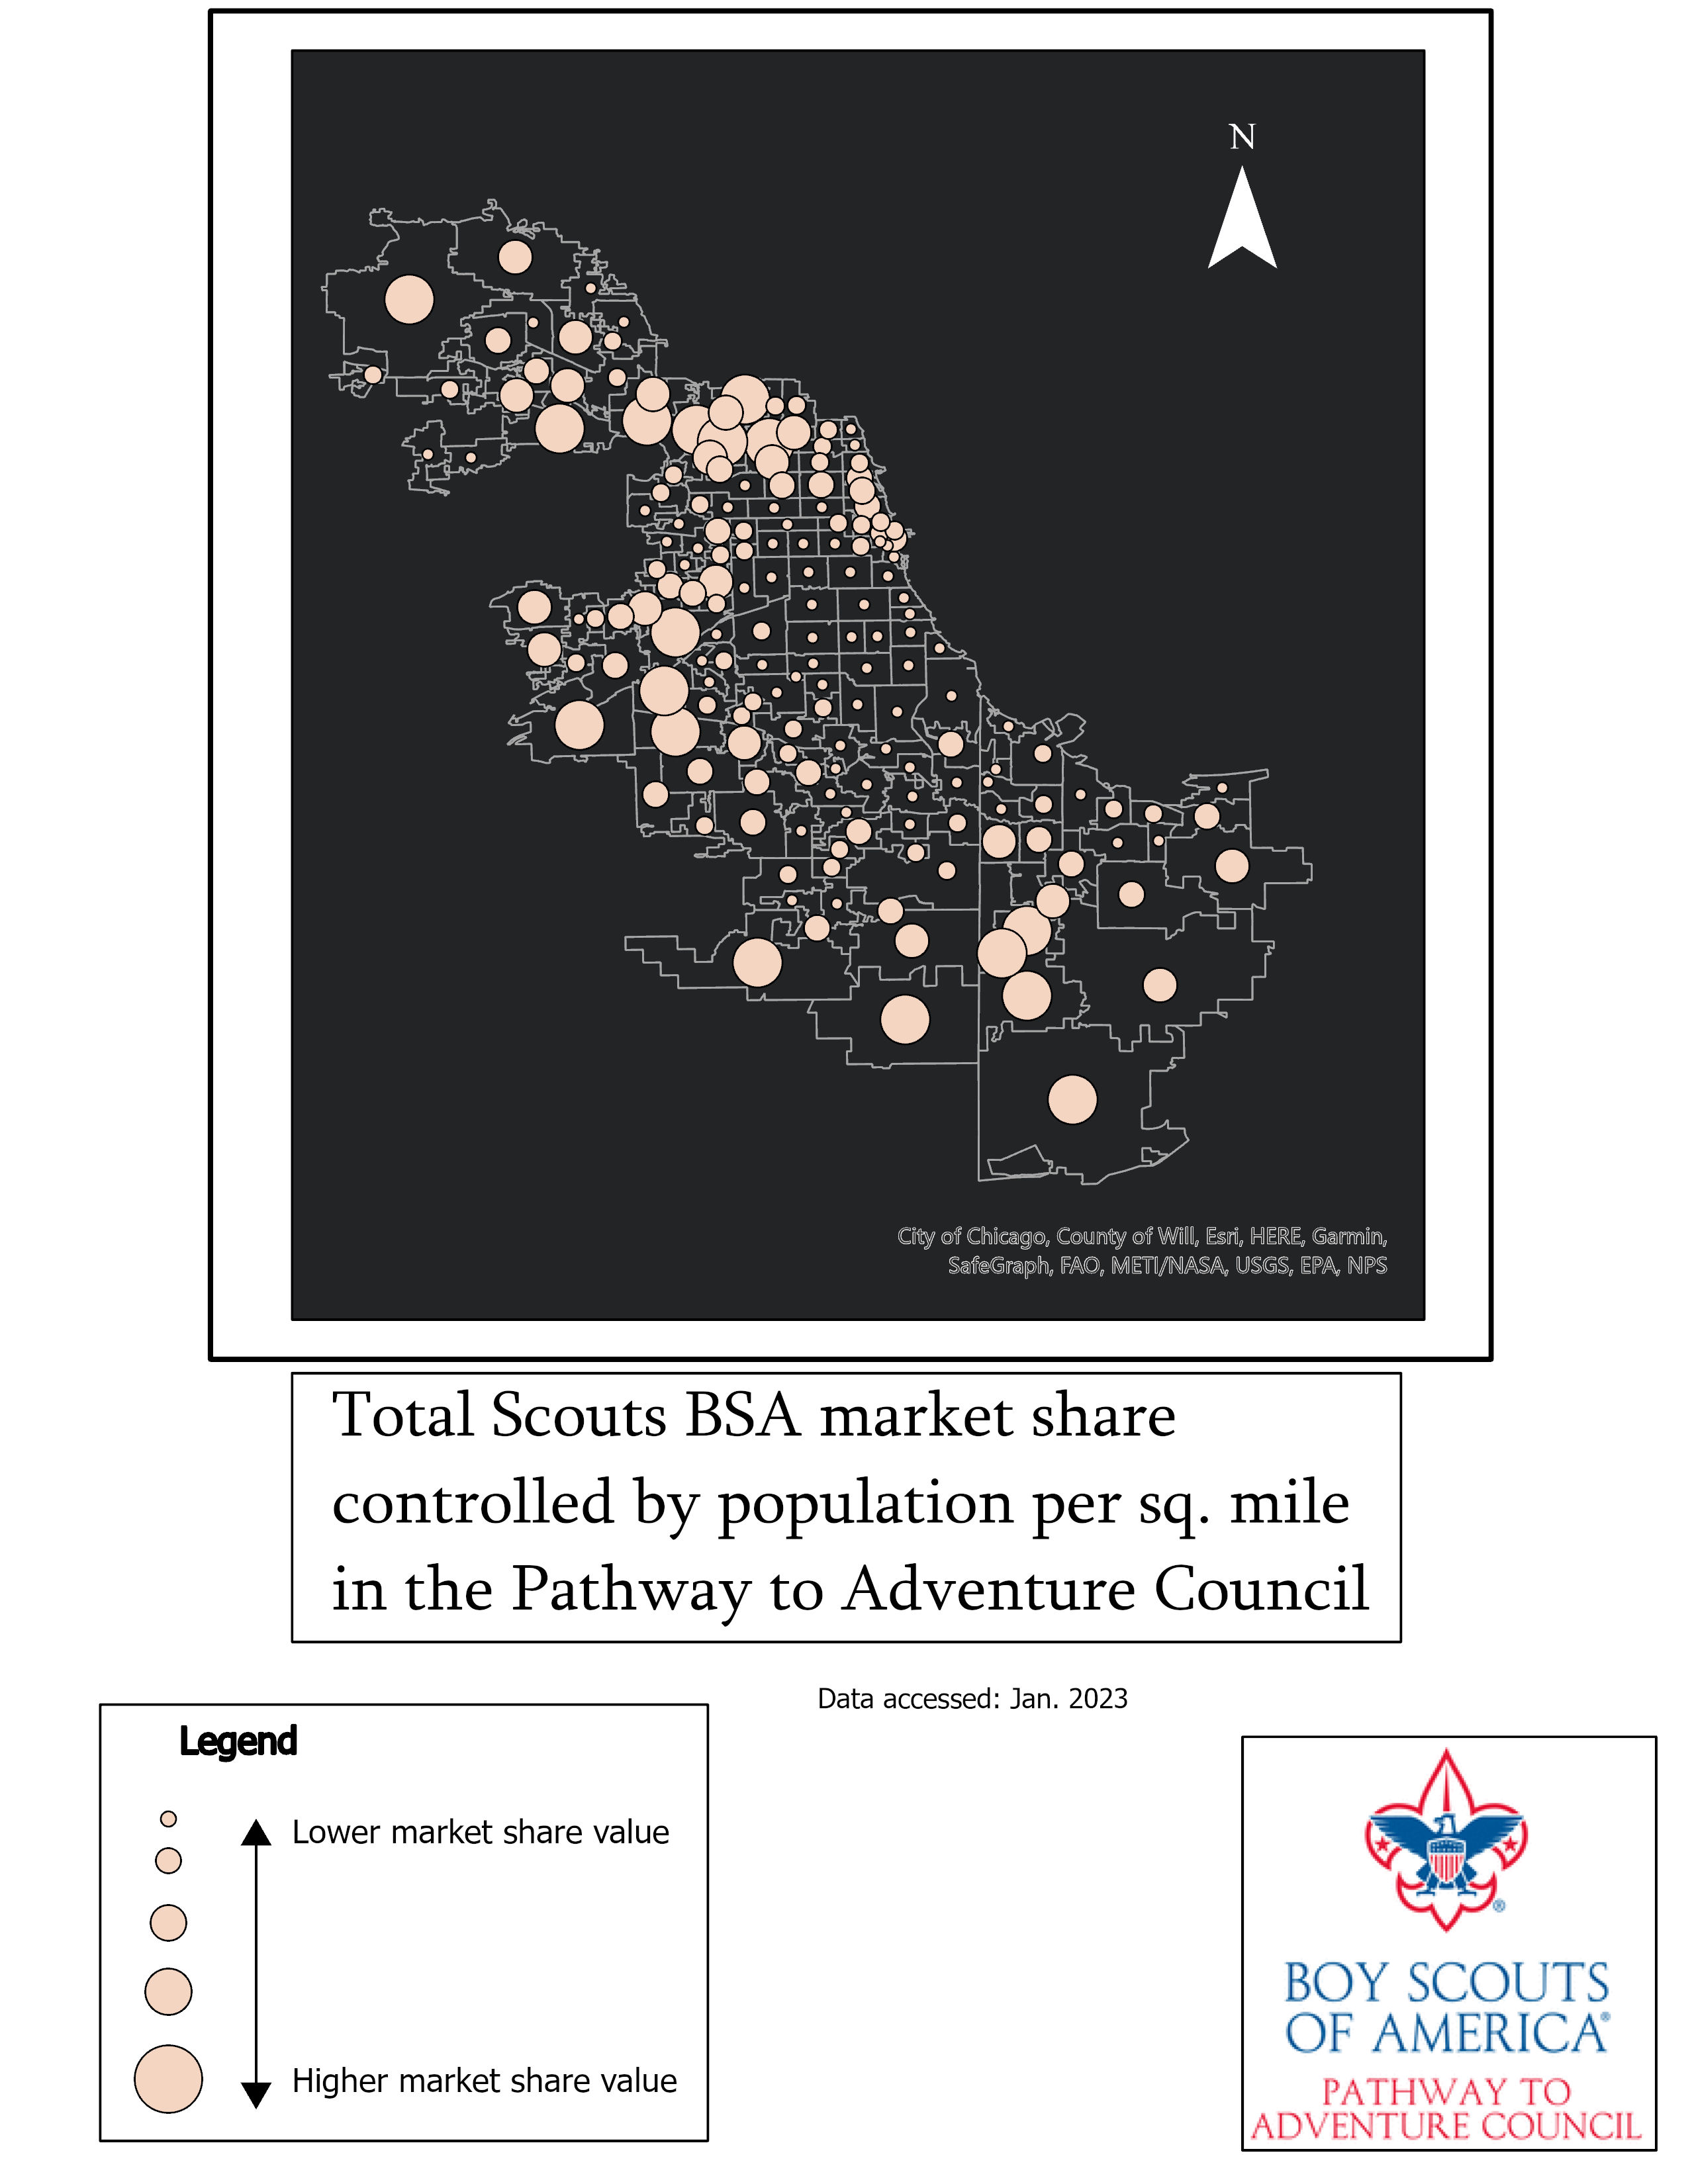
Total Scouts BSA by Population
This analysis compares population density with Scouts BSA membership numbers to identify trends and opportunities for growth. By mapping membership data against demographic distribution, it highlights areas where Scouting is underrepresented and where recruitment efforts should be prioritized.